College - Chart Patterns
Technical patterns found on the charts are an excellent way to anticipate future market movement and assist with a strategic alignment ...

Chart Patterns
Technical patterns found on the charts are an excellent way to anticipate future market movement and assist with a strategic alignment of confluences. Unfortunately, some are under the false impression that market direction cannot be predicted and that all movement is random. However, with a professional and deeper understanding, a trader’s life becomes exceedingly simplified through observing the market's repetition of forming patterns over 10,000 times. In order to understand these moves and take advantage of them, it is necessary to implement chart-based rules. Only once the key levels of support and resistance are plotted along with the determination of the trend direction, may you then focus on these patterns. Chart patterns are repeated in the market time and time again; think of it as a template. You shall study this template and become skilled in recognizing the characteristics of certain patterns so that you are armed and one step ahead of the market. The nuisance that is the World Wide Web allows anybody to share what they believe to be various aspects of price patterns, from formations of the “Fire-Breathing Dragon” all the way to the “Niagara Falls” pattern. Fortunately for you, we have collated the most significant chart patterns in one place. Pens and papers to the ready!
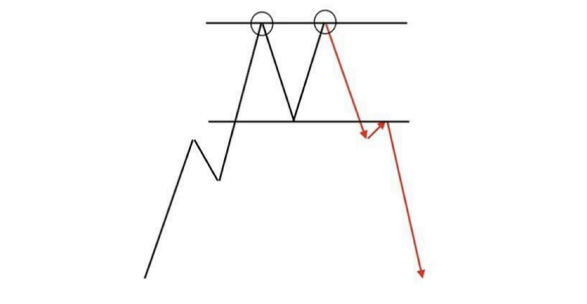
Double Top
A double top indicates a key selling opportunity by showing us clear barriers in price, which has trouble breaking. The market will rise to a strong key level of resistance twice, with the second time forming a clear bearish candlestick formation bringing with it a chance of reversal to the downside. After the initial rejection from the resistance key level, the price will tend to fall and create a base known as the neckline. The price will then have a second attempt at testing the same level of resistance, which is the highlighted strip in the image below. Often, the price is seen to spike above the resistance, creating a new high if the prevailing trend is bullish. Double tops frequently provide the highest chance of reversal at weekly and monthly levels of resistance on the Daily or H4. After a confirmed signal to take a short trade from the double top formation, the neckline acts as a firm target. Always be aware of the bigger picture’s directional bias presented by the overall timeframes.
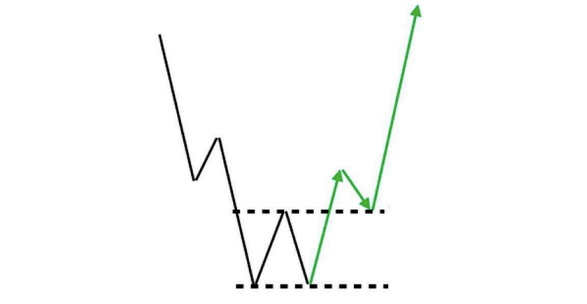
Double Bottom
The double bottom is also a reversal pattern, but in this case, it comes after a run of bearish momentum at a key level of support. The price declines and hits a strong key level of support where it is rejected and then returns to test it for a second time, forming a neckline as pictured below. This second rejection confirms the double bottom formation—ideal for a buying opportunity or even an exit if you have been holding a short trade over a considerable period of time.
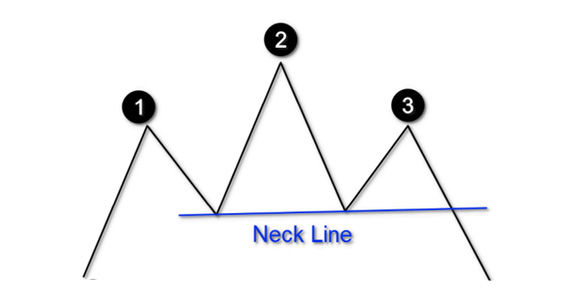
Head and Shoulders
Yet another reversal formation, the head and shoulders chart pattern is formulated by three characteristics and can be spotted on the majority of timeframes. However, the setup and execution perform best on the Daily and H4. How to spot:
- Left shoulder (1): The prevailing trend must be that of a bullish one, with the price anticipating its next move around a key level of resistance. Price action may often form a bearish candlestick formation, acting as a catalyst for a deep pullback.
- Head (2): The following wave will continue to rise, forming a new high before forming another bearish reversal, leading the new price slightly lower once again. This peak is the highest point in the pattern.
- Right shoulder (3): Finally, the price will rise again, but this time it will not exceed the previous high, thus forming a lower high from the head.

Once head and shoulders play out:
Once we have correctly established the head and shoulders pattern, a neckline is drawn by the connection of the lowest points of the two troughs. It is now possible to anticipate a break to the downside. The right shoulder is also known as a lower high. Once this is formed and breaks the neckline, the price declines. This break and the area of close vicinity below are great selling execution points. If you decide to execute a sell position and take a short trade, an ideal position to place your stop loss would be above the right shoulder. We can calculate a target level by measuring the distance between the highest point of the head and the neckline. This distance is duplicated onto the breakout point, thus giving you your target level as displayed on the chart.
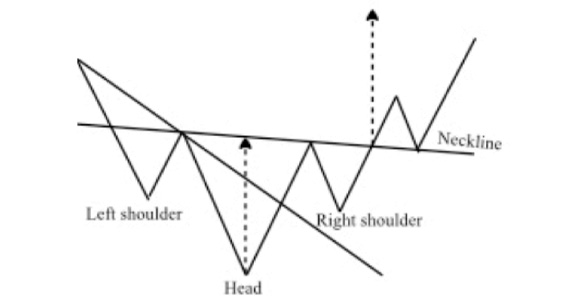
Inverse Head and Shoulders
The previous pattern may also be applied in bearish market conditions in a reverse aspect. The exact rules apply,
however, it is simply the other way around. Once the neckline is broken, you will be expecting the market to provide you
with a long set up, otherwise known as bullish.
Once you have chosen to execute a long trade, you should place your stop loss around the right shoulder. Just as the
target level was calculated on the head and shoulders pattern, you would now measure the distance between the valley
of the head to the neckline and duplicate it into the breakout point.
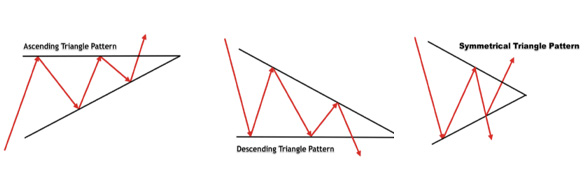
Triangle Formations
Forming when a particular currency pair is anticipating a sudden strong trend continuation move, triangles can be a great chart formation for breakout traders to take advantage of. Price action tends to build up over a small period of time and the trick is to trade only once the triangle breaks in the direction of the overall trend. This can be on weekly or daily timeframes.
This form of pattern should be approached with caution as they do have a tendency to form false breakouts in the opposite
direction before continuing in the same direction. Depending upon the type of triangle you are presented with, you will have a better indication and capitalise on this.
The three most prominent triangle formations are discussed below: