Elementary
Welcome to the first day of elementary school! Get ready to dive into a crucial part of your daily routine as a trader. Today, we’re talking ...
What Are Trend Lines?
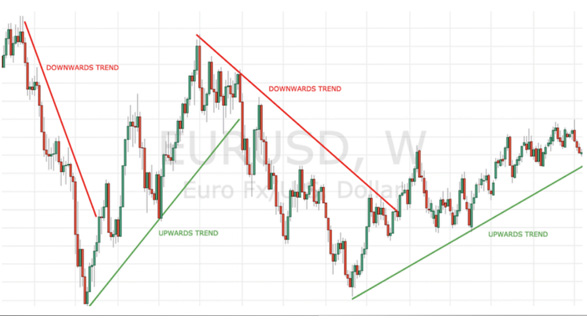
Welcome to the first day of elementary school! Get ready to dive into a crucial part of your daily routine as a trader. Today, we’re talking about Trend Lines—the backbone of identifying market direction. In the forex market, you have two main actions: buying and selling. But how do you know which one to choose? The key lies in understanding the market’s direction, and that’s where Trend Lines come in! These are essential tools for traders and will soon become your best friend on the charts. Many traders incorrectly place trend lines, which can lead to poor trading decisions. But once you learn to spot and draw them accurately, they will help you interpret market direction with precision. Here’s what a typical trend line looks like:
Types of Trend Lines
There are two types of trends:
- 1.Downward Trend
- 2.Upward Trend
Upward Trend (Bullish)
An upward trend, also called a bullish trend, suggests you should look for buying opportunities.
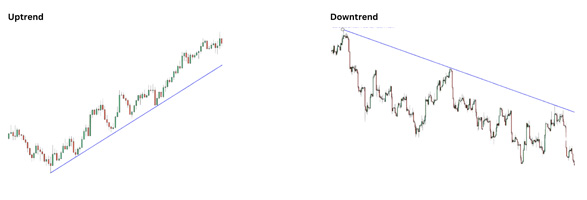
Downward Trend (Bearish)
A downward trend, known as a bearish trend, signals it’s time to consider selling opportunities. Want an easy way to remember the difference between bulls and bears? Think of how they attack: Bulls thrust their horns upward, while bears swipe their paws downward. Easy enough, right? Uptrend Downtrend
Finding Market Direction
Now that you know what a trend line looks like, the challenge is drawing one accurately. Fortunately, certain market features can help you spot trends.
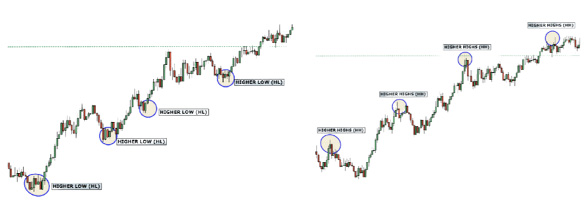
Upward Trend Features:
- Higher Lows (HL): In an upward trend, the market creates a series of higher lows as it retraces before continuing its bullish momentum.
- Higher Highs (HH): As the market swings higher, it forms a new higher high after retracing from the previous higher low.
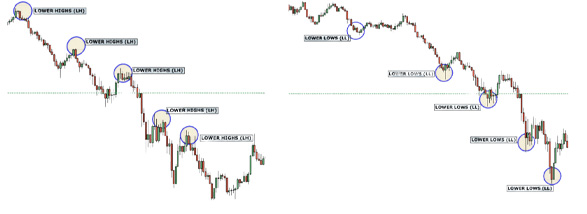
Downward Trend Features:
- Lower Highs (LH): In a downward trend, the market will retrace upward, but the swing leaves a lower high before pushing downward again.
- Lower Lows (LL): As the market pushes lower, it breaks the previous lower low, continuing the bearish movement.
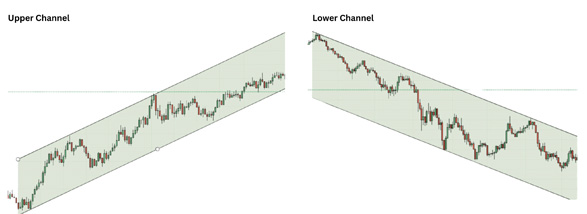
Channels: Adding Structure to Trends
Once you’ve identified your HH, HL, LH, or LL, it’s time to draw a parallel line—this creates what we call a forex channel! These channels are crucial for identifying support and resistance levels, which are essential in determining entry and exit points.
- Upper Channel: A good opportunity for buying.
- Lower Channel: A good opportunity for selling.
Sideways Market
As a trader, you must be able to spot and trade in different market conditions. The market can either trend or move sideways (range-bound). Many traders mistakenly believe the market trends more often than it does. In reality:
- Trending Market: 30%
- Sideways Market: 70%
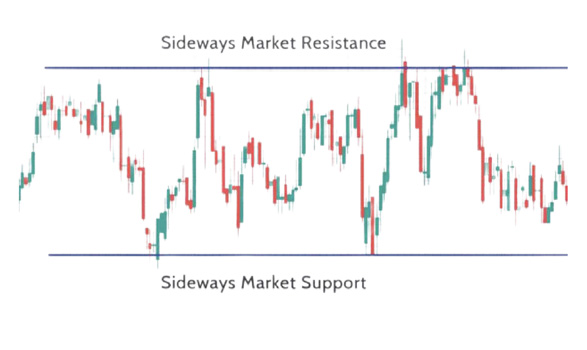
A sideways market occurs when supply and demand are balanced.
How can you spot a sideways market? Unlike trending markets where you find HH, HL, LH, or LL, a sideways market won’t have these features. If
you can’t identify these, you’re likely in a sideways market.
Trading in a Sideways Market
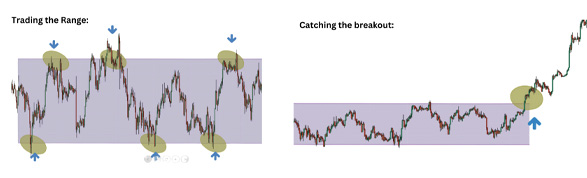
Although many traders feel frustrated when encountering a sideways market, this shouldn’t be the case! Now that you understand the nature of sideways markets, you can adapt and still make profits. Here are three ways to trade them:
- Trading the Range: Identify the range’s highs and lows using support and resistance, and take advantage of the predictable entry, stop loss, and target points.
- Catch the Breakout: After consolidating, the market may make a sudden move, continuing in the same direction. This is known as breakout trading or continuation.
- Stay Flat: If the market doesn’t suit your strategy, the best course of action is to stay out. Exercise patience and return once your ideal setup
appears.
Key Levels: Your Guideposts
Key levels are vital tools in the forex market. They help you pinpoint entries, exits, and even stop-loss placements. Recognizing key levels accurately is crucial; any mistakes could lead to costly errors.
How do Key Levels Work?
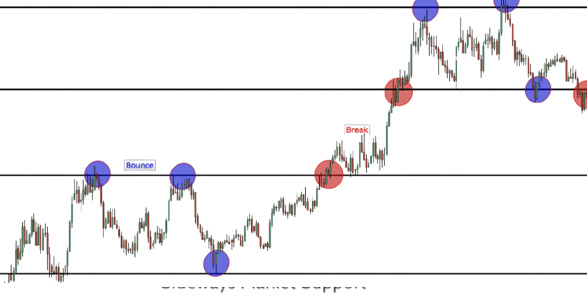
At a key level, the price tends to do one of two things:
1.Break: The price will move aggressively to a new key level.
2.Bounce: The price will reverse and head back to the previous key level.
Always ensure a candle closes before confirming a break to avoid a fake out. Patience is key!
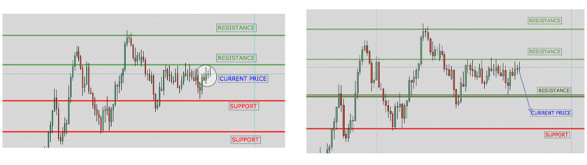
Support and Resistance: Key Categories
Key levels fall into two categories:
- Resistance: Key levels above the current price.
- Support: Key levels below the current price.
The current price determines whether a key level is support or resistance. If the price breaks a key support level, it becomes resistance, and vice
versa.
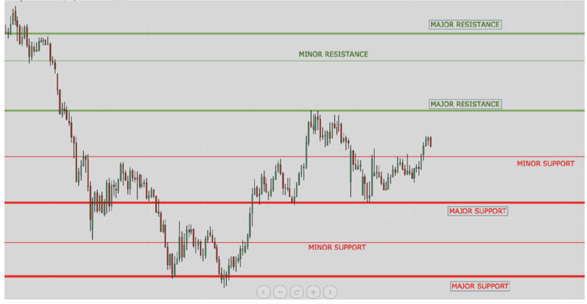
Advanced Support and Resistance
Now that you understand the basics, it’s time to advance to major and minor key levels. The bigger picture always takes precedence, meaning that
support or resistance on a higher time frame (4-hour or daily) will be more significant than on a lower time frame (5-minute or 30-minute).
Stronger Support/Resistance: These levels act as bigger barriers and, once broken, add momentum to the move.
As a beginner, spotting key levels may feel challenging, but with practice, it will become second nature.
Remember to focus on major time frames rather than small ones, as this will give you a clearer view of the market.
Congratulations! You've completed elementary school. With your newfound knowledge of trend lines, key levels, and market structure, you’re ready to move on to more advanced topics. But don’t forget—practice makes perfect! Keep doing your homework, and we’ll see you in high school soon.