High School
Remember when we introduced you to the world of forex charts in your early days with us? One of the most popular charts we touched on ...
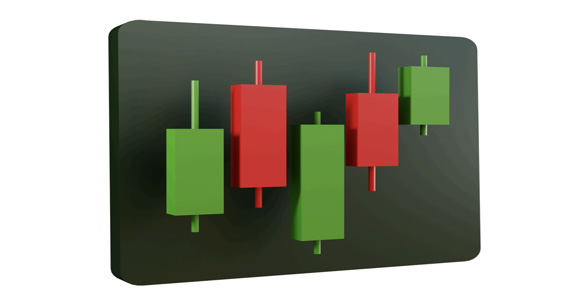
Japanese Candlesticks
Remember when we introduced you to the world of forex charts in your early days with us? One of the most popular charts we touched on was the Japanese candlestick chart. Now that you're in high school with us, it’s time to dive deeper into the details of these powerful tools. Ready? Let’s jump in!
The History of Candlesticks
Though candlesticks have been a central tool in Japanese trading for centuries, their adoption in the West is relatively new, gaining popularity in the U.S. trading community only about 25 years ago. Initially considered too complex and timeconsuming, this charting technique found its place with the rise of computer software, forever changing the landscape of trading. Candlesticks are essential because they capture price action in its purest form, giving traders a clear, visual representation of market movements. Though the signals from candle charts are similar to bar charts, candlesticks are preferred for their reliability and the clarity they offer. Visual aids are proven to enhance understanding, and no amount of indicator usage can replace the solid, clear signals that candles provide when it comes to understanding support and resistance.
The Doji
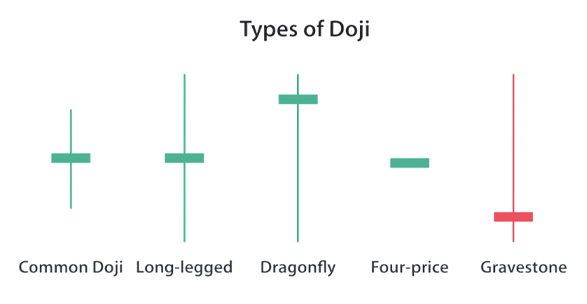
A Doji candlestick forms when the open and close prices are almost identical, indicating indecision in the market. Think of it like a tug-of-war between buyers and sellers (cue a mental image of a tug-of-war between bullish buyers and bearish sellers). Throughout the session, the price moves up and down but eventually closes right where it started, signaling a stalemate. The appearance of a Doji is a time to take notice, as it could indicate an upcoming reversal, depending on the previous candles. There are four main types of Doji candlesticks, and they vary in appearance with different shadow lengths. Despite these variations, the core message remains the same: the market is unsure which way to go next.
Spinning Tops
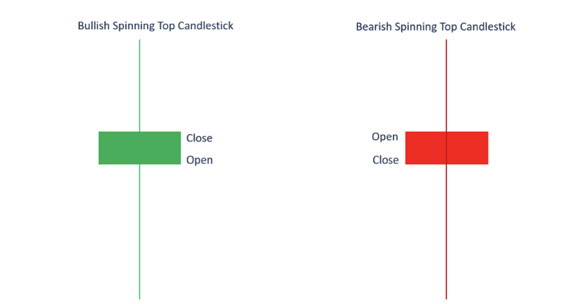
Spinning tops have long upper and lower shadows, with a small real body, and their color doesn’t matter. What matters is the indecision they
signal between buyers and sellers. The long wicks show that prices fluctuated widely during the session, yet the small body shows that neither
side managed to gain a clear advantage. It’s a perfect snapshot of market uncertainty.
The Hammer
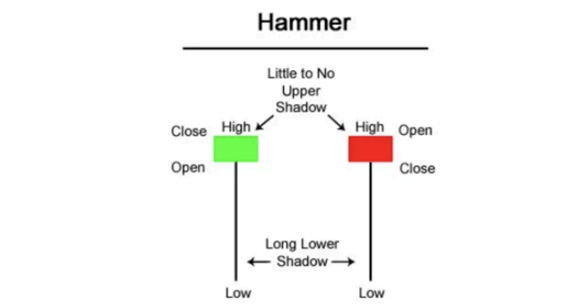
Despite looking like the Hanging Man candlestick, the Hammer tells a very different story.
This candlestick forms after a decline and is a bullish reversal signal, suggesting that a market bottom is near. The long lower shadow shows that
sellers pushed prices lower, but buyers swooped in to take control, closing the price near the open. In essence, the market is ‘hammering’ out a
bottom, signaling that prices may soon rise.
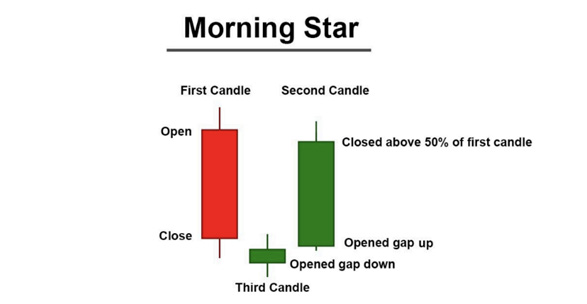
Morning Star
This formation consist of three candlesticks and serve as powerful indicators of market reversals.
Let’s break them down:
Morning Star: This pattern indicates a potential reversal of a downtrend:
1.A bearish (red) candlestick showing selling momentum.
2.A candlestick (Spinning Top, Doji, or Hammer) that signals indecision.
3.A bullish (green) candlestick that closes within the upper 40% of the range of the first bearish candle.
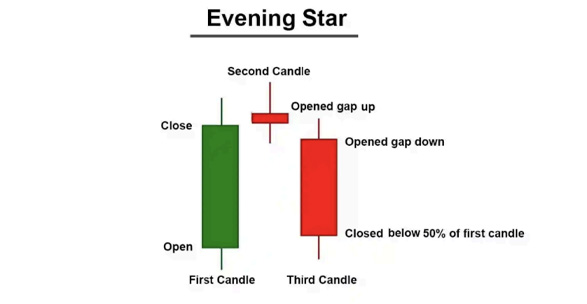
Evening Star:
The opposite of the Morning Star, this pattern forms at the top of an uptrend and signals a potential reversal:
1.A bullish (green) candlestick showing buying momentum.
2.A candlestick indicating indecision (Shooting Star, Doji, or Hammer).
3.A bearish (red) candlestick closing within the lower 40% of the first candle.
A completed Evening Star signals that a downtrend may be underway, so look for selling opportunities on the next candle.
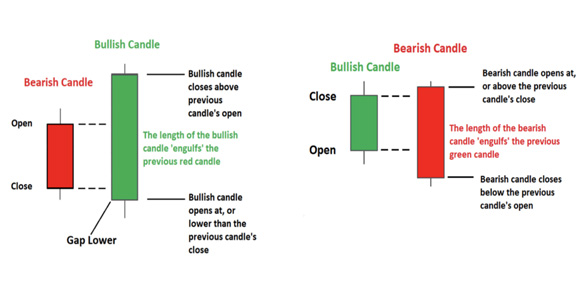
Bullish and Bearish Engulfing Candlesticks
A Bullish Engulfing pattern signals a potential reversal at the end of a downtrend. It consists of a large bullish (green) candle that completely
engulfs the previous bearish (red) candle. This shift in sentiment shows that buyers are stepping in and taking control, usually indicating a
strong reversal.
A Bearish Engulfing pattern is the opposite. At the top of an uptrend, a large bearish (red) candle engulfs the prior bullish (green) candle,
signaling that sellers are gaining control and a downtrend may be imminent.
downtrend may be underway, so look for selling opportunities on the next candle.
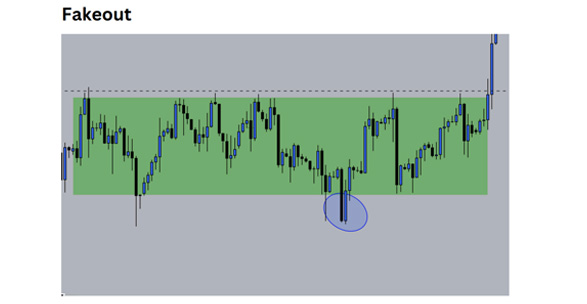
Breakouts and Fakeouts
In forex trading, there are generally two camps: those who
love trading in sideways ranges and those who prefer waiting
for breakouts.
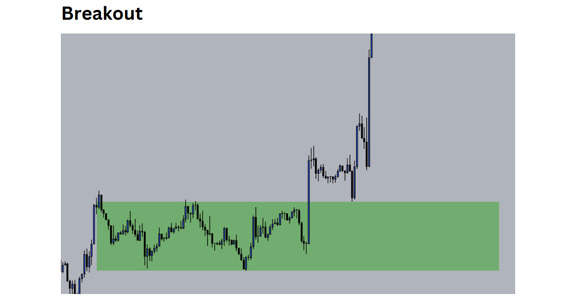
A breakout occurs when the price breaks through a support or resistance level and continues moving in that direction, while a fakeout happens when the price breaks the level but doesn’t follow through The key to trading breakouts is ensuring the breakout is genuine. A true breakout closes beyond the key level of support or resistance, while a fakeout often results in a price reversal back into the previous range. Fakeouts are often caused by market manipulation or trapped retail traders’ stop losses, so be cautious.
How to Spot a Fakeout
Fakeouts typically occur when the price briefly breaks a
support or resistance level but fails to close beyond it, leaving
behind a long wick (a candle with a spike). These false moves
are often the result of macroeconomic data releases, which
trigger volatility in the market. Avoid trading during these
moments unless you’re certain the move is genuine.
Macroeconomic Data and Fundamentals
Macroeconomic data, or fundamentals, play a huge role in forex trading.
These include interest rate announcements, inflation figures, and
employment reports, all of which can drastically affect currency
prices. As a forex trader, you must stay up to date with the economic
calendar to anticipate how these fundamentals may impact the
markets.
 Let’s quickly review some of the most crucial macroeconomic
indicators:
Let’s quickly review some of the most crucial macroeconomic
indicators:
- Interest Rates: Higher interest rates attract investment, driving currency value up, while lower rates do the opposite.
- Non-Farm Payroll (NFP): This U.S. employment report causes significant market volatility, particularly in USD pairs.
- GDP: A higher GDP signals a healthy economy, driving currency value higher, while a lower GDP has the opposite effect.
- Inflation: High inflation usually leads to tighter monetary policy (higher interest rates), strengthening the currency. These data releases can be found on economic calendars such as Forex Factory and Investing.com